|
The Serenity MottoI shall strive for the serenity to accept the things I cannot change, the determination to change the things I can, and the wisdom to know the difference.
|
|
|
The Serenity MottoI shall strive for the serenity to accept the things I cannot change, the determination to change the things I can, and the wisdom to know the difference.
|
| It's odd to apply the 12-Step program's serenity motto to television production, but that's what this section is about... making the best pictures that we can, fixing what we are able to fix, and knowing when to blame factors that we can't control! |
|
|
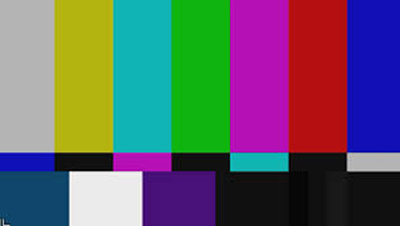
There are 16,777,216 different colours that our cameras can reproduce... 24 bit colour, which is 256 shades EACH of Red, Green, and Blue. There are a lot of crazy adjustments that we can make, but a very simple setup will make the camera almost 100% right. |
|
|
We use a chart with NO COLOR at all, just some gray steps from black to white. (Chip Chart) If we can adjust the camera to show no colour on this chart, the R, G, and B sensors are correct, and colours should be good. Each R,G,and B channel in the camera has adjustments for its brightness and contrast, referred to as "gain", and "Pedestal" (Black Level) |
|
|
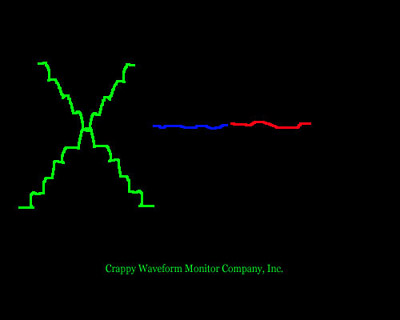
Remember that the cB and cR components on the waveform monitor are at mid-scale when there is no colour, the balanced chart will look like this. |
|
|
|
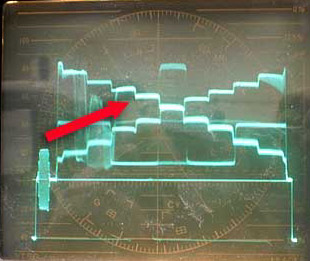
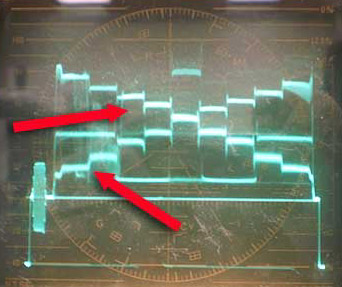
| This is a common studio camera shooting a chip chart.
Observe the steps. This picture can look better... check out the one on
the right.
Below is video without, and with Detail Enhancement. |
Here, some processing has been done to the image to
enhance fine detail. Wherever the video takes a sudden change, the
change is emphasized... those little spikes on the steps. Also notice
that the darker steps do NOT have this effect applied, as it enhances
any noise (snow) in the darker parts of the picture. The correct setting
for detail enhancement is "I can just see it".
Cameras that have the full amount of pixels in their sensors generally don't use enhancement. |
|
|
|
|
|
|
 |
|
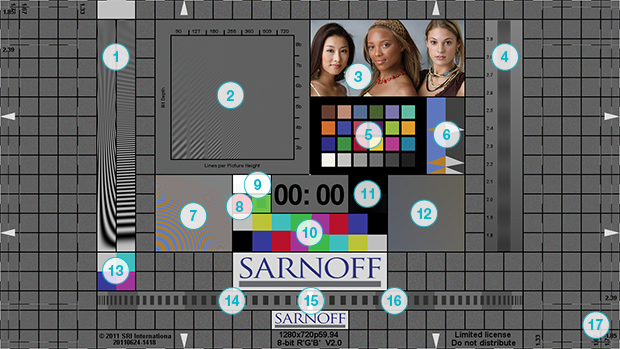
| Above is a "Sarnoff Visualizer" Chart. It is the type of chart that we need these days (as you will see when we get to the digital impairments). The chart tells us too many things to mention, but it is a live playback chart, with a moving pip that tells us that we haven't lost the signal, and that the audio is in sync. There is lots of detail not present in this web still. If you look carefully under the "9" circle, you will see a slightly different green box inside the green box. The red, blue, and white boxes are hidden by the number bubbles, but are similar. This can show errors in the conversion of one file format to another. The "swoopy" areas of detail are best seen with the below examples... |
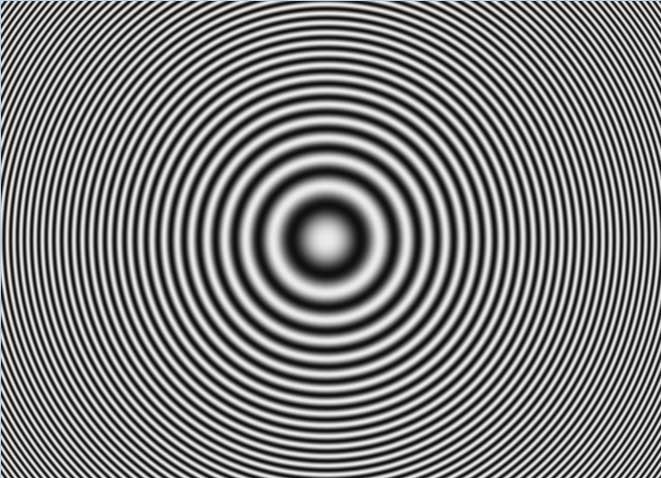
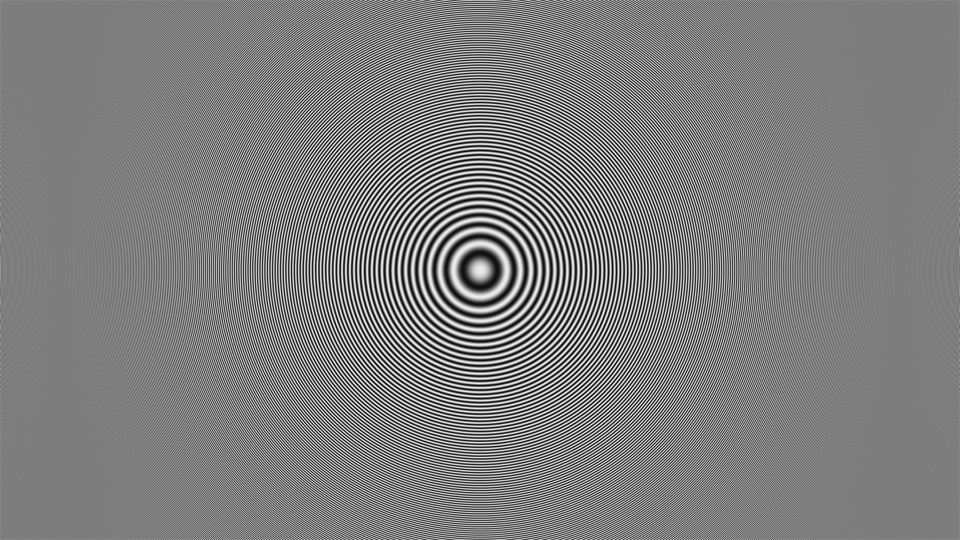
| This is a "Zone Plate". Zone Plate applications are found all over optical science. This is the center portion of a large chart with more and more finer circles going outward. |
| Here's your full zone plate resized to half size for this presentation. Some ghostly other circles have appeared from the re-sizing process. |
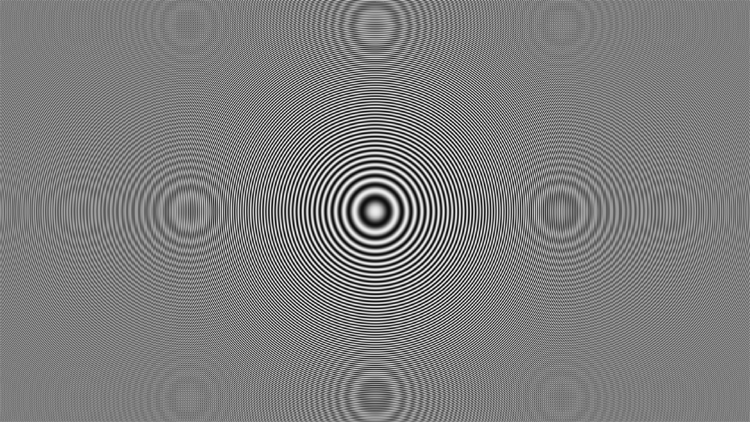
| This is resized by an odd fraction. The ersatz circles are very prominent. This kind of artifact shows in pictures that are displayed on a different sized pixel grid... say a 1920 x 1080 picture displayed on a panel with only 1280 pixels across. |
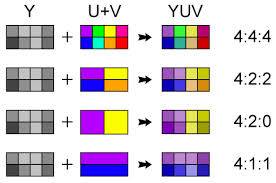
| I would really like to leave this
out. You can skip to the last two sentences now if you like.
These ratios come from the old BetaCam 4:2:2 thing with the squished colour channels that were sampled at half the rate of "Four Times Subcarrier". The colour channels were sampled at "Two Times Subcarrier". Just for the record, that wasn't even true, it was more like 3.77 times subcarrier and 1.88 times subcarrier, but 4:2:2 became the gold standard. When you see a ratio like 4:1:1, it means that there are four Y channel samples "coloured" by one value. The colour has less resolution than Betacam, but the Y channel still contains all of the detail. 4:2:0 has the same thing going on as 4:1:1 but the samples are on adjacent rows. Above all, notice from the chart that the colour "blobs" still have different shades from the underlying Y information. There is also a 4:4:4:4 which denotes a full-bandwidth Alpha Channel for keying transparency. The Hoity-Toity even have an 8:8:8:8! It's mostly for better image compositing. It really doesn't matter. All still have the brightness detail, and look pretty good. |
![]()
![]()
|
|
|
|
|
|